Associate Data Analyst Portfolio by Zaleha Ali

This is a Github project page dedicated to me becoming Assoc Data Analyst Programmer
In this page, I will be featuring the Capstone projects that I have embarked using Excel Dashboard, MS SQL, PowerBI and Python
Contact Info - zaleha.ali3@gmail.com
View My LinkedIn Profile
View the Project on GitHub ZalehaAli/Data-Analytics-Portfolio
Projects
The Capstone is an open project, wherein participants choose their own data, brainstorm ideas and create insightful dashboards/sldes as an end result
Summative Project
Advanced Analytics and Build a Machine Learning Model with Python, SQL and Power BI
View Power BI (Audit Log Data)
View Python Program
Scope of Work -
The main aim of the Summative Project is to enable students to apply and integrate what they have learnt and give them an opportunity to delve in greater depth, into one or more of the topics covered in the course. Participants, as part of the capstone project, will have to exhibit the following:
- Data collection from various sources
- Create Schema in SQL and interface to Python
- Exploratory Data Analysis
- Data Preparation
– Feature Engineering
– Data Cleaning
– Data Transformation - Data Analysis using visualizations
- Creating Machine learning models and evaluating performance
- Interface relevant audit information in a database table and interface to SQL
- Write inputs and corresponding predicted output to database table and interface to SQL
- Showcase all audit info and Predictions captured in SQL in Power BI
- Communicating insights derived
- Presenting to the stakeholders
Technologies and Applications used: Jupyter Notebook, Anaconda, Numpy Python 3.8, MS SQL Server Management Studio 18,Power BI, MS Powerpoint
Data source: Kaggle - Used Cars Price Prediction
Capstone Project 4
Advanced Analytics and Build a Machine Learning Model with Python
Scope of Work -
The main aim of the Capstone Project 4 is to exhibit the five stages of the data lifecycle through the use of various machine learning algorithms: Linear Regression, Logistic Regression, SVM, K-means, Random Forest and any other machine learning models learnt during the course. Participants, as part of the capstone project, will have to exhibit the following:
- Data collection from various sources
- Exploratory Data Analysis
- Data Preparation
– Feature Engineering
– Data Cleaning
– Data Transformation - Data Analysis using visualizations
- Creating Machine learning models and evaluating performance
- Communicating insights derived
- Presenting to the stakeholders
Technologies and Applications used: Jupyter Notebook, Anaconda, Numpy Python 3.8, MS Powerpoint,
Data source: Yahoo Finance
Capstone Project 3
Creating Interactive Dashboard and Data Storytelling with Power BI

View Power BI Dashboard
Scope of Work -
The main aim of the Capstone Project 3 is to exhibit the five stages of the data lifecycle using PowerBI on the dataset provided. Participants, as part of the capstone project, will have to exhibit the following:
- Importing the Data
- Structuring the Data Tables
- Data Preparation
– Data Cleaning
– Data Transformation - Visualizing and Formatting the Data
- Creating Interactive Dashboard in PowerBI
- Communicating insights derived
- Narrating Story to the Stakeholders
Technologies and Applications used: Power BI
Data source: Fortune Global 500, Forbes Global 2000,Dogs of the Dow
Capstone Project 2
Analyzing data using SQL and import data to Excel to create Interactive Dashboard
View Screenshot of SQL Program
Scope of Work -
The main aim of the Capstone Project 2 is to exhibit the five stages of the data lifecycle through the use of two tools: SQL and MS Excel. Participants, as part of the capstone project, will have to exhibit the following:
- Data collection from various sources
- Creating tables and Loading data into SQL databases
- Data Preparation
– Data Cleaning
– Data Transformation - Data Analysis using SQL
- Creating Interactive Dashboard and Visualization using Excel Dashboards
- Communicating insights derived
- Presenting to the stakeholders
Technologies and Applications used: MS Excel 365, Power Query, MS SQL Server Management Studio 18, MS Powerpoint
Data source: Kaggle - Sales of summer clothes - Wish
Capstone Project 1
Creating Interactive Dashboard and Data Storytelling with Excel
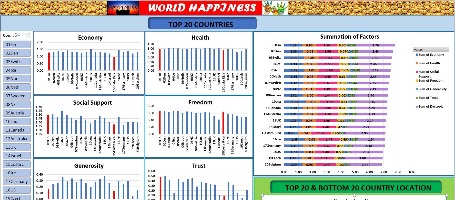
View Excel Dashboard
Scope of Work -
The main aim of the Capstone Project 1 is to exhibit the five stages of the data lifecycle through the use of the tool: MS Excel. Participants, as part of the capstone project, will have to exhibit the following:
- Data collection from various sources
- Business needs gathering
- Story building in relation to business needs
- Data Preparation
- ETL
- Data Cleaning
- Data Transformation
- Exploratory Data Analysis using Excel
- Creating Interactive Dashboard and Visualization using Excel Dashboards
- Communicating insights derived based on decided business needs
- Presenting to the stakeholders
Technologies and Applications used: MS Excel 365
Data source: Kaggle - World Happiness Report
Other Projects
Hackathon - Working as a team within a limited time to analyze and present results and recommendations to stakeholders

View Hackathon PowerBI Dashboard
View Screenshot of Loan Dataset
Scope of Work -
Teams were created randomly and assignment given to all teams to be completed by the end of the day (ie. 4pm).Teams are to present their cases in PowerBI Dashboard within 10 mins. Following is the case given to all Teams -
Financial institutions/companies have been using analytics for quite a long time.
Off late, due to the availability of computational resources and tremendous research in analytics field,
it is possible to perform cutting edge data analysis resulting in making business strategies and improving decision making.
Below are a few suggested perspectives:
- Purpose of loan
- Outstanding Amount
- State wise loan applications
- Loan application trend
- Loan Status Distribution
Technologies and Applications used: Power BI
Data source: Provided by Organizer
Page template forked from evanca